How to Build a Lead Scoring Model in a Spreadsheet
You don't need expensive tools to score leads. This guide shows you how to build a practical lead scoring model in a spreadsheet you can start using today.
Posted by
Related reading
How to Run a Weekly Pipeline Review (Template Included)
A weekly pipeline review keeps your team focused and your forecast honest. Here's how to run one in 30 minutes, with a template you can copy.
How to Track Competitor Activity for Sales Intelligence
Knowing what your competitors are doing helps you time outreach and sharpen messaging. Here's how to track competitor activity without expensive tools.
GDPR and B2B Outreach: What You Can and Cannot Do in 2026
GDPR doesn't ban B2B outreach — but it does set rules. Here's a plain-English guide to what you can and cannot do when prospecting in the UK and EU.
Most lead scoring conversations start with someone suggesting you buy a platform — HubSpot, Salesforce, or one of the dozens of tools that charge hundreds per month for scoring features. And sure, those platforms work well if you're generating thousands of leads per month and have a dedicated ops person to manage the system.
But here's the thing: you don't need any of that to score leads effectively. A spreadsheet — Google Sheets, Excel, whatever you already have — can do the job perfectly well. Especially if you're a small team running targeted outbound, or a founder who just wants to know which leads deserve attention first.
This guide walks you through building a lead scoring model in a spreadsheet from scratch. We'll cover what to score, how to weight different factors, and how to use the output to make faster, better decisions about where to spend your time. No theory fluff. Just a practical model you can build this afternoon and start using tomorrow.
Why Lead Scoring Matters (Even for Small Teams)
Lead scoring solves a very specific problem: you have more leads than you can work at once, and you need a way to decide who gets your attention first.
Without scoring, most teams default to "first in, first out" — whoever arrives first gets worked first. That sounds fair, but it's terrible for conversion. A VP of Sales at a 200-person company who's actively evaluating solutions gets the same priority as an intern who downloaded a whitepaper. That's not fair — it's random.
Lead scoring replaces randomness with a system. You assign points based on how well a lead fits your ideal customer profile and how much buying intent they've shown. The leads with the highest scores get worked first. Simple.
The benefits are immediate, even with a basic model:
- You focus on better opportunities. Instead of working leads in order of arrival, you work them in order of likelihood to convert. This means more conversations with people who actually have budget, authority, and a real problem to solve.
- You respond faster to hot leads. When a high-scoring lead comes in, you know immediately. No more discovering a week later that someone great filled out your contact form while you were chasing a dead end.
- You waste less time on bad fits. Scoring makes it obvious which leads aren't worth pursuing. That intern who downloaded the whitepaper? They score a 5 out of 100. You don't ignore them forever, but you don't drop everything either.
- You build institutional knowledge. The scoring model forces you to articulate what makes a good lead. That knowledge lives in the spreadsheet, not just in one salesperson's head.
If you want to understand what "good" looks like in more depth, our guide on measuring warm lead quality covers the metrics that matter. But for now, let's build the model.
What You Need Before You Start
Before opening a spreadsheet, you need three things:
1. A clear ICP (Ideal Customer Profile). You need to know who you're selling to. What industries? What company sizes? What job titles? What problems do they have that your product or service solves? If you don't have this nailed down, your scoring model will be guessing.
If you haven't built an ICP yet, start with our guide to building an ICP first. It doesn't take long, and everything else depends on it.
2. A list of leads to score. This can be a CRM export, a list from an outbound campaign, inbound form submissions — anything. You need at least 20–30 leads to make the model useful. If you only have five leads, you don't need a scoring model. You need to call all five.
3. Historical data on what converted. Look at your last 10–20 closed deals (or qualified conversations, if you don't have that many deals). What did those companies have in common? What did those contacts look like? This is the foundation of your scoring criteria.
If you don't have historical data, that's fine. You'll build the model based on your best assumptions and refine it as data comes in. A rough model is better than no model.
Step-by-Step: Building Your Scoring Model
Here's exactly how to set this up. I'll walk through it in Google Sheets, but the same approach works in Excel or any spreadsheet tool.
Step 1: Set up your columns
Create a new spreadsheet with these columns:
- Column A: Lead Name — the contact's name
- Column B: Company — the company they work at
- Column C: Job Title — their role
- Column D: Company Size — employee count or revenue range
- Column E: Industry — what sector they're in
- Columns F–J: Scoring criteria — we'll define these next
- Column K: Total Score — the sum formula
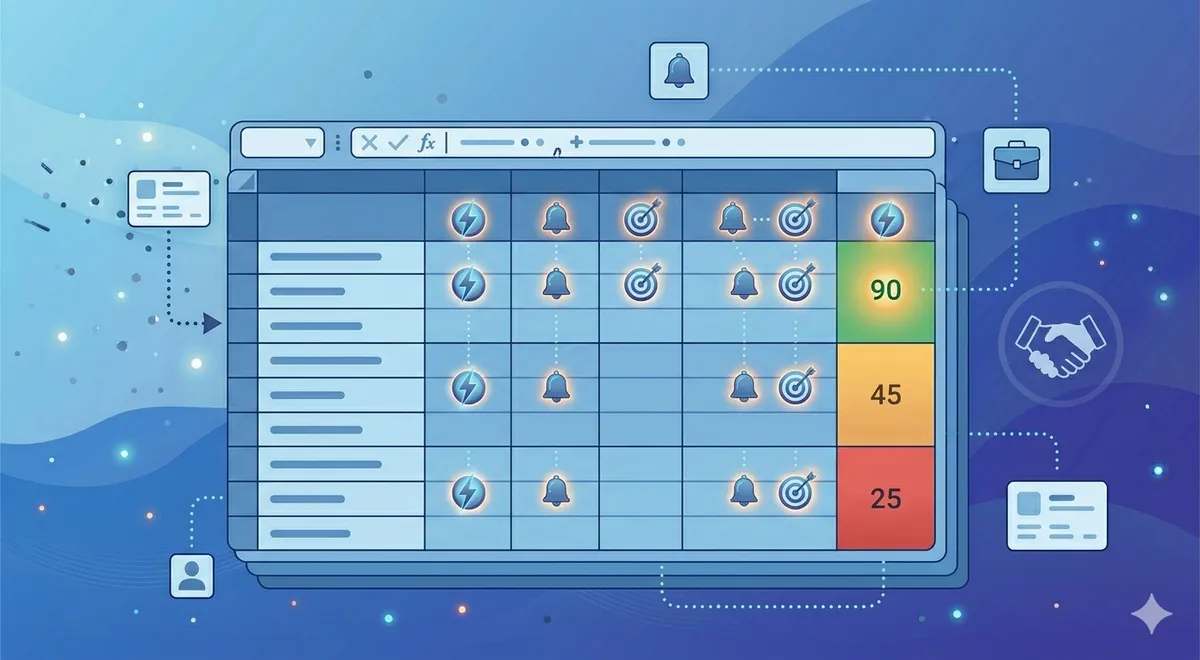
- Column L: Priority — High / Medium / Low based on score thresholds
Step 2: Define your scoring criteria
You'll score leads across three dimensions: Fit, Intent, and Engagement. Here's how to think about each one.
Fit criteria measure how closely the lead matches your ICP. These are static facts about the person and their company.
- Job title match (0–25 points): Decision-maker (VP, Director, C-suite) = 25. Manager-level = 15. Individual contributor = 5. Irrelevant title = 0.
- Company size match (0–20 points): Exactly in your sweet spot = 20. Adjacent = 10. Too small or too large = 0.
- Industry match (0–15 points): Target industry = 15. Adjacent industry = 8. Unrelated = 0.
Intent criteria measure whether the lead is showing signs of actively evaluating solutions.
- Intent signal detected (0–25 points): Active buying signal (demo request, pricing page visit, competitor research) = 25. Mild signal (content download, webinar attendance) = 12. No signal = 0.
Engagement criteria measure how much the lead has interacted with your outreach or content.
- Engagement level (0–15 points): Replied to email or accepted LinkedIn connection = 15. Opened multiple emails = 8. No engagement = 0.
That gives you a total possible score of 100 points. You can adjust the specific criteria and point values to match your situation, but this framework works well as a starting point.
Step 3: Create a scoring key tab
Add a second tab to your spreadsheet called "Scoring Key." This is where you document what each score value means. For each criterion, list out every possible value and its point allocation. This does two things: it makes the model auditable (anyone on the team can understand how scores are calculated), and it forces you to be precise about what qualifies for each point level.
Your scoring key tab should have three columns: Criterion, Value, and Points. For example: Job Title | C-suite | 25. Job Title | Director/VP | 25. Job Title | Manager | 15. And so on.
Step 4: Score your existing leads
Go back to your main tab and score each lead against every criterion. Be honest. If you don't know something (like whether a lead has shown intent), score it as zero rather than guessing high. The model only works if the inputs are accurate.
In Column K, add a SUM formula: =SUM(F2:J2). This gives you the total score.
In Column L, use an IF formula to assign priority: =IF(K2 >= 70, "High", IF(K2 >= 40, "Medium", "Low")). Adjust the thresholds based on your data — if most of your leads score between 30–60, you might set High at 55+ instead.
Step 5: Sort and act
Sort the spreadsheet by Total Score (Column K) in descending order. Your best leads are now at the top. Work them first. Review the "Low" priority leads at the bottom — some may not be worth pursuing at all.
Add a "Status" column to track what happens next: Contacted, Meeting Booked, Qualified, Disqualified, etc. This creates a simple pipeline tracker right inside the same sheet.
How to Weight Fit vs Intent vs Engagement
The point allocations above give roughly equal weight to Fit (60 points maximum) and Intent+Engagement (40 points maximum). But the right balance depends on your business.
If you're doing outbound to a defined list: Weight Fit more heavily (60–70% of total possible points). You already know who you're targeting, so the scoring model is primarily about confirming whether the company and contact match your ICP.
If you're working inbound leads: Weight Intent and Engagement more heavily (50–60% of total). Inbound leads have already shown some interest by coming to you, so fit becomes the differentiator — but their behaviour tells you who's serious.
If you're using intent data: Intent should be the single biggest factor (30–40% alone). A perfect-fit company with no buying intent is worth less than a good-fit company that's actively evaluating solutions. Intent is the timing signal that tells you whether to reach out now or later.
Don't overthink the weighting at the start. Set it, use it for two weeks, then look at which scored leads actually converted. If high-scoring leads aren't converting, your weights need adjusting. If low-scoring leads are converting, you're missing something in your criteria.
Common Mistakes and How to Avoid Them
Lead scoring sounds simple, and it is — but there are a few traps that catch most people the first time.
Scoring too many things. If you have 15 criteria and each one has five possible values, the model becomes unmanageable. Nobody will maintain it. Stick to 4–6 criteria maximum. You can always add more later once the basic model is working.
Using vanity signals. Social media followers, website traffic estimates, and press mentions feel like they should matter, but they rarely correlate with buying intent. Score things that actually predict whether someone will buy: job title, company size, industry, intent signals, and direct engagement.
Not revisiting the model. A scoring model isn't a set-it-and-forget-it thing. Review it every month. Look at which leads scored high but didn't convert, and which scored low but did. Adjust your criteria and weights based on what you learn.
Scoring leads you shouldn't be working at all. If a lead is obviously outside your ICP — wrong industry, wrong geography, wrong company size — don't score them. Remove them from the list entirely. Scoring should help you prioritise good leads, not validate bad ones.
Letting the model override common sense. A spreadsheet model can't capture everything. If a lead scores 35 but you know they just raised funding and are hiring for exactly the role your product serves, follow your judgement. The model is a guide, not a decision-maker.
Not sharing the model with the team. If multiple people are working leads, everyone needs to use the same scoring criteria. Otherwise, one person's "high priority" is another person's "medium." Share the spreadsheet, walk the team through the scoring key, and make sure everyone understands how to use it.
When to Outgrow the Spreadsheet
A spreadsheet lead scoring model works well when you're dealing with up to a few hundred leads at a time and have a small team. But there are clear signs you need to move to a dedicated tool:
- You're scoring more than 500 leads per month. Manual scoring doesn't scale beyond this. You'll spend more time entering data than acting on it.
- You need real-time scoring. If leads are coming in from multiple channels and you need scores updated instantly, a spreadsheet that you update manually won't cut it.
- Multiple people are editing the same sheet. Version conflicts and accidental overwrites become a real problem.
- You want to automate actions based on scores. If a lead hits 80 points, you want an automated email to fire or a task to be created in your CRM. Spreadsheets can't do this without complex integrations.
- You have enough historical data for predictive scoring. Once you have 200+ closed deals, machine learning models can identify patterns you'd never spot manually. That's when tools like HubSpot's predictive scoring or dedicated platforms earn their price.
But don't jump to a paid tool prematurely. The spreadsheet version forces you to think through your scoring logic manually, which makes you much better at configuring and tuning any tool you eventually adopt. Skipping the spreadsheet stage often leads to poorly configured automated scoring — garbage in, garbage out, but faster.
If you'd rather have someone handle the scoring and outreach for you, our intent-based approach focuses on leads already showing buying signals, so the scoring is built into the process.
Frequently Asked Questions
How many scoring criteria should I use?
Start with 4–6. That's enough to differentiate leads without making the model too complex to maintain. A common setup: job title match, company size match, industry match, intent signal, and engagement level. You can add a sixth criterion for something specific to your business — like technology stack or geography — if it's a strong predictor of conversion. Don't exceed 8 criteria in a spreadsheet model. Beyond that, the manual data entry becomes the bottleneck.
What if I don't have intent data?
You can still build a useful model without intent data. Focus on Fit (title, company size, industry) and Engagement (email opens, replies, LinkedIn interactions). The model will be less predictive — you won't be able to distinguish between good-fit companies that are ready to buy now versus those that won't buy for another year — but it's still far better than no scoring at all. As you get access to intent signals, add them as a high-weight criterion.
Should I use negative scoring?
Yes, if you want. Negative scores can flag disqualifying factors: wrong geography (−10), competitor employee (−25), personal email address (−5), or unsubscribed from emails (−15). Negative scoring makes the model more accurate because it pulls obviously bad leads down the priority list quickly. But it also adds complexity. Start without negative scoring, and add it after a month once you understand what disqualifies leads in practice.
How often should I update the scoring model?
Review the model monthly. Look at two things: which high-scoring leads actually converted (validation), and which leads that converted had low scores (gaps in your model). Adjust criteria and point values based on what you find. The model should get more accurate over time. If it's not, you're either not reviewing it or not making changes based on the review.
Can I automate any of this in a spreadsheet?
Somewhat. You can use data validation dropdowns for scoring inputs (so you pick from preset options instead of typing numbers), conditional formatting to colour-code priority levels, and VLOOKUP or INDEX/MATCH to pull scores from your Scoring Key tab automatically. Google Sheets can also integrate with tools like Zapier to pull in lead data from your CRM or forms. But the actual scoring — evaluating whether a lead matches each criterion — will still be manual until you move to a dedicated tool.
What's a good score threshold for "high priority"?
It depends on your score distribution. A common starting point: 70+ is High, 40–69 is Medium, under 40 is Low. But look at your actual data after scoring 50+ leads. If 80% of leads score above 70, your thresholds are too generous. If only 2% score above 70, they're too strict. Adjust so that roughly 15–25% of leads fall into the "High" bucket — that's usually the right amount of focus for a small team to handle.
Skip the Spreadsheet — We Score and Prioritise for You
Totalremoto monitors buying signals and delivers leads that are already scored for intent and fit. Instead of building your own model, you get a pipeline of warm leads from companies actively evaluating solutions like yours.
See how it works or learn about our intent-based lead generation.